
Florida PPEC in 2026: A Public-Record View of Supply, Access, and Ownership
A market brief from Harbor — where Florida's 204 active PPEC centers are, where supply is thin relative to need, and how the ownership market is moving.
At a glance
Florida's Prescribed Pediatric Extended Care sector operates roughly 9,700 licensed beds across 204 active centers, concentrated heavily on the eastern coast and serving an estimated population of medically complex children that varies materially by region.
This brief reports three findings from public-record data:
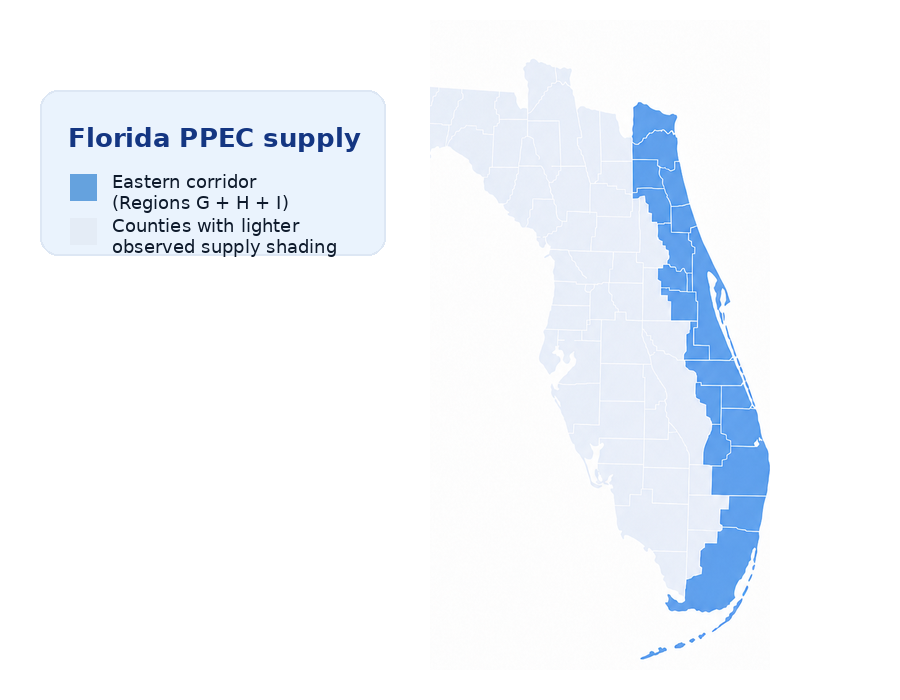
- Supply is concentrated on the east coast. Just over half of Florida's PPEC capacity sits in the eastern corridor from St. Lucie County through Miami-Dade. The Panhandle and North Florida hold the smallest share.
- Supply relative to pediatric SSI enrollment varies by roughly 3.6x across regions. Measured as licensed beds per pediatric SSI enrollee, the most-resourced region (Miami-Dade and Monroe) runs at 0.19 beds per SSI-enrolled child under 21; the least-resourced (the Panhandle) runs at 0.05.
- One in five locations is under ownership less than two years old. This activity is concentrated in central and southwest Florida — not in the densely-supplied southeast — and is distributed across many small new licensees rather than consolidating under any single operator.
For families, uneven PPEC supply can mean longer drives, fewer placement options, and greater fragility in continuity of care. For operators and policymakers, it shows where infrastructure may not be keeping pace with medically complex pediatric need.
These findings are based on Florida AHCA's March 2026 enrollment data, U.S. Census ACS 2022 5-year estimates, and Harbor's public PPEC intelligence layer. Methodology and limitations are detailed at the end of this brief.
1. Where the supply is
Florida's PPEC sector comprises 204 active licensed centers operating in 35 of the state's 67 counties as of the latest public observation. Total licensed capacity is approximately 9,700 beds.
The geographic distribution is sharply uneven. The three southeastern counties — Miami-Dade, Broward, and Palm Beach — together hold roughly half of all locations and just under half of total capacity. Adding St. Lucie, Martin, Indian River, and Okeechobee counties (the rest of AHCA's SMMC Region G), the eastern coastal corridor from the Treasure Coast through Monroe County accounts for 108 of 204 locations (53%) and 4,907 of 9,675 beds (51%).
The remaining half of Florida's PPEC supply is distributed across the rest of the state, with the largest concentrations in the Tampa Bay metro (Hillsborough, Pinellas, Polk, Manatee), the Orlando metro (Orange, Osceola, Seminole, Brevard), and the Jacksonville metro (Duval and surrounding counties).
Top counties by location count
| County | Region | Locations | Capacity |
|---|---|---|---|
| Miami-Dade | I | 57 | 2,581 |
| Broward | H | 25 | 1,205 |
| Palm Beach | G | 19 | 771 |
| Orange | E | 14 | 611 |
| Hillsborough | D | 11 | 586 |
| Polk | D | 9 | 408 |
| Duval | B | 8 | 539 |
| Lee | F | 6 | 235 |
| Brevard | E | 5 | 207 |
| Osceola | E | 5 | 343 |
| Pinellas | C | 5 | 269 |
Miami-Dade alone holds 28% of Florida's PPEC locations and 27% of capacity. The next-largest county, Broward, holds 12% and 12%. The top five counties together hold 56% of locations and 53% of capacity.
The other half of the geography is more striking. Thirty-two of Florida's 67 counties have no observed PPEC location. Of the 35 counties that have at least one, 23 have only one or two — leaving most of the state's PPEC infrastructure operating in a small number of metro markets.
This distribution is not by itself an access claim. PPEC capacity should reasonably concentrate where pediatric populations and Medicaid enrollment concentrate. The next section examines whether the supply geography actually matches the geography of medically complex pediatric population.
2. Where supply appears thin relative to need
The largest medically complex pediatric population in Florida lives in Region B — and Region B has one of the lowest bed-per-SSI ratios in the state. With 21,403 children enrolled in pediatric SSI as of March 2026, Region B (North Florida and Northeast, including Jacksonville and the Big Bend area) holds the largest pediatric SSI population of any AHCA region. It operates 23 PPEC centers and 1,202 beds — approximately one PPEC bed for every 18 SSI-enrolled children under 21. This puts Region B near the bottom of Florida's regional access distribution despite holding the largest medically complex pediatric population in the state.
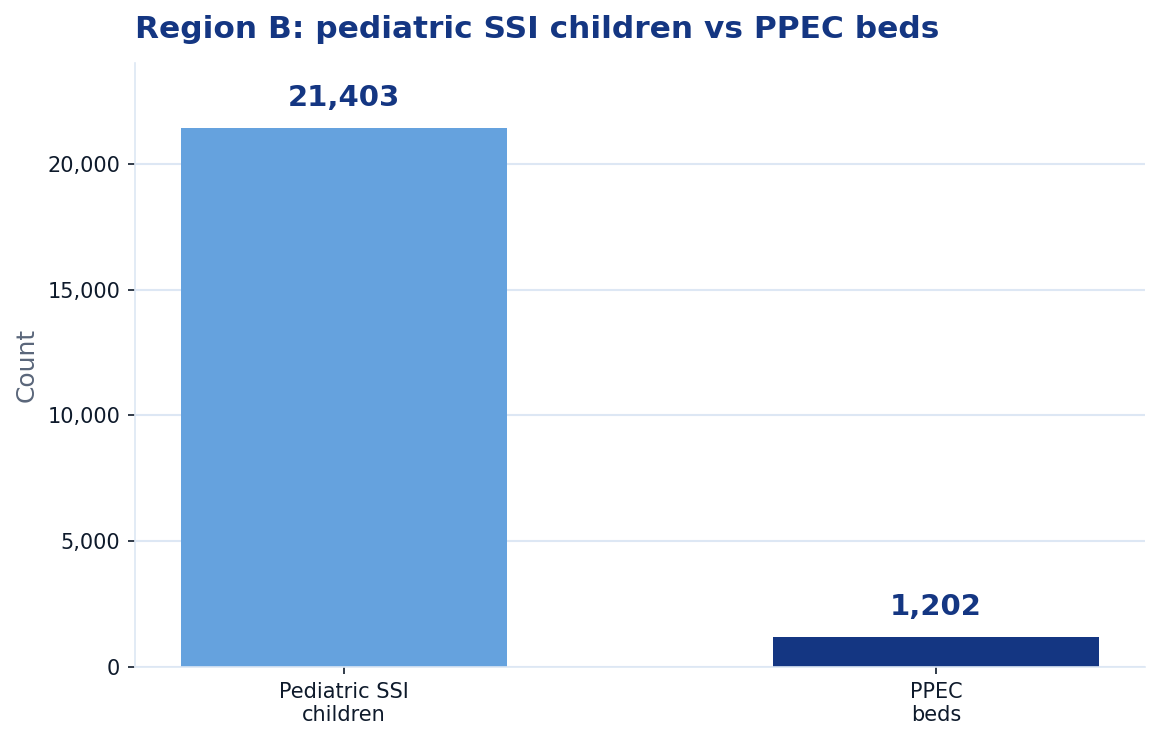
This finding is the clearest single signal in the brief that PPEC infrastructure is not currently distributed in proportion to the population it serves.
Estimating the population PPEC serves
PPEC eligibility centers on children with medically complex conditions who require ongoing skilled care during the day — a population that is broader than any single published Medicaid category.
For this brief we use pediatric SSI enrollment (children under 21 enrolled in SSI Medicaid, including SSI Medicaid-only and SSI Duals) as the closest publicly available proxy. SSI eligibility for children requires a Social Security disability determination, which applies a federal medical and functional standard. Pediatric SSI is therefore a tighter proxy for medical complexity than total pediatric Medicaid, even though it is not perfectly equal to PPEC-eligibility — some medically complex children are enrolled in TANF Medicaid rather than SSI, and not every SSI-enrolled child requires PPEC-level care.
Florida's SMMC regions (A through I) align roughly with the state's metropolitan and rural geography. Pediatric SSI enrollment varies materially across them, with Region B holding the largest pediatric SSI population at 21,403 children, and Region F (Southwest Florida) holding the smallest at 5,487.
Beds per pediatric SSI child by region
| Region | Geography (summary) | Locations | Capacity | Pediatric SSI | Beds per SSI Child |
|---|---|---|---|---|---|
| A | Panhandle | 7 | 429 | 7,981 | 0.054 |
| B | North FL & Jacksonville | 23 | 1,202 | 21,403 | 0.056 |
| C | West Central (Pasco/Pinellas) | 7 | 369 | 5,827 | 0.063 |
| D | Central (Tampa/Polk) | 21 | 1,029 | 16,721 | 0.062 |
| E | East Central (Orlando) | 26 | 1,233 | 15,790 | 0.078 |
| F | Southwest | 12 | 506 | 5,487 | 0.092 |
| G | Treasure Coast | 26 | 1,121 | 7,522 | 0.149 |
| H | Broward | 25 | 1,205 | 8,415 | 0.143 |
| I | Miami-Dade & Monroe | 57 | 2,581 | 13,316 | 0.194 |
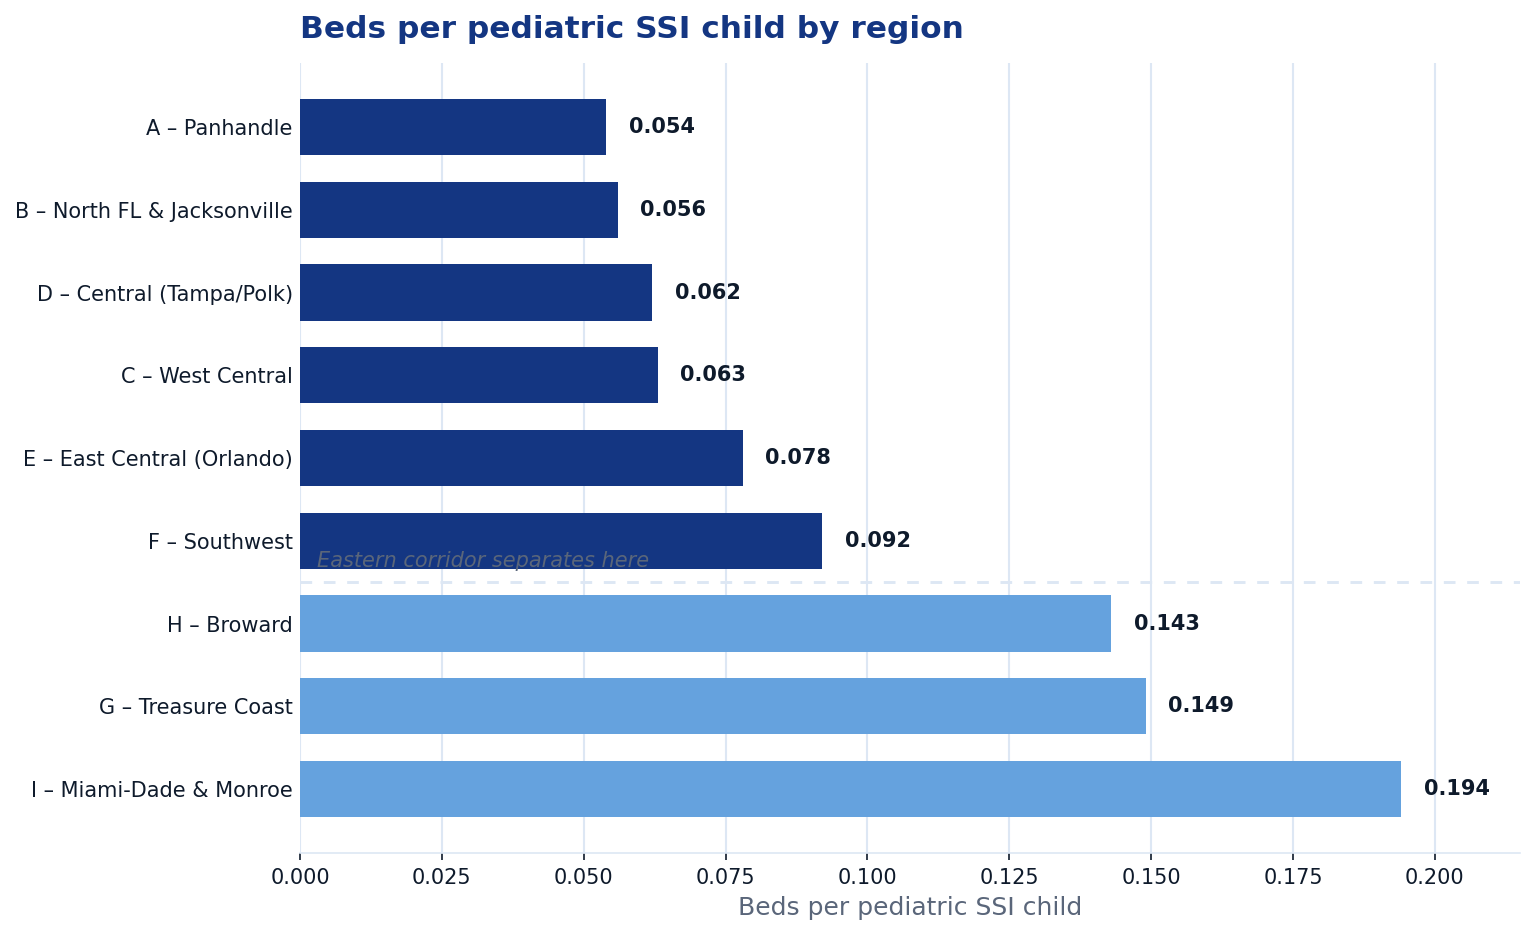
The pattern is striking. The three eastern coastal regions — G, H, and I — run at 0.143 to 0.194 beds per pediatric SSI child. Every other region runs at 0.054 to 0.092. The most-resourced region (Miami-Dade and Monroe) carries roughly 3.6 times the bed-per-SSI ratio of the least-resourced region (the Panhandle).
The east-west asymmetry is notable as well. The eastern corridor's supply advantage stops at the Treasure Coast on the east coast and does not appear on the gulf coast. Region F (Lee, Collier, Sarasota, and surrounding counties) sits at 0.092 — about half of Region G's 0.149 just across the state. This brief does not attempt to explain the asymmetry; the observation that it exists may itself be useful to operators and policymakers considering where to invest.
Ratios under alternative denominators
PPEC eligibility is not the same as pediatric SSI enrollment. To check whether the regional pattern holds under different population assumptions, we computed the same ratios using two additional denominators:
- Pediatric Medicaid total under 21 (SSI plus TANF Medicaid): a broader, less complexity-adjusted denominator.
- Total population under 18 (Census ACS 2022 5-year estimate): a purely demographic denominator.
In both alternatives, the same regional pattern holds. The eastern corridor (G, H, I) runs at higher ratios than the rest of the state, and Region A remains at the bottom of the distribution. The magnitude of the disparity narrows somewhat under the broader denominators — pediatric SSI is the most sensitive measure — but the directional finding is consistent across all three.
3. How the market is moving
Beyond the static supply picture, Harbor observes ownership activity in the public licensure record. For each licensed PPEC location, AHCA publishes a "current owner since" date. We use this date to count locations whose current ownership has held the license for less than 24 months as of the latest observation.
Across the 204 active licensed centers, 41 locations (20%) are under current ownership less than two years old. This is a meaningful share of the state's PPEC infrastructure to be in relatively new hands — by either acquisition of an existing center or first licensure of a newly operating center under that owner.
It is important to be precise about what this measure does and does not isolate. The public record reports when current ownership began, not when a center first received its initial license. A location whose "current owner since" date is recent could be a center that changed hands from a prior licensee, or a center that received its first-ever license to a new owner within the window. The available public data does not distinguish these two populations. We refer to the combined measure as "ownership activity," and treat it as a single number rather than attempting an unsupported split.
Ownership activity by region
| Region | Locations | Recent ownership (≤24 months) | Share | Capacity under recent ownership |
|---|---|---|---|---|
| A | 7 | 0 | 0% | 0 |
| B | 23 | 4 | 17% | 145 |
| C | 7 | 2 | 29% | 57 |
| D | 21 | 9 | 43% | 480 |
| E | 26 | 5 | 19% | 210 |
| F | 12 | 5 | 42% | 200 |
| G | 26 | 5 | 19% | 139 |
| H | 25 | 5 | 20% | 239 |
| I | 57 | 6 | 11% | 164 |
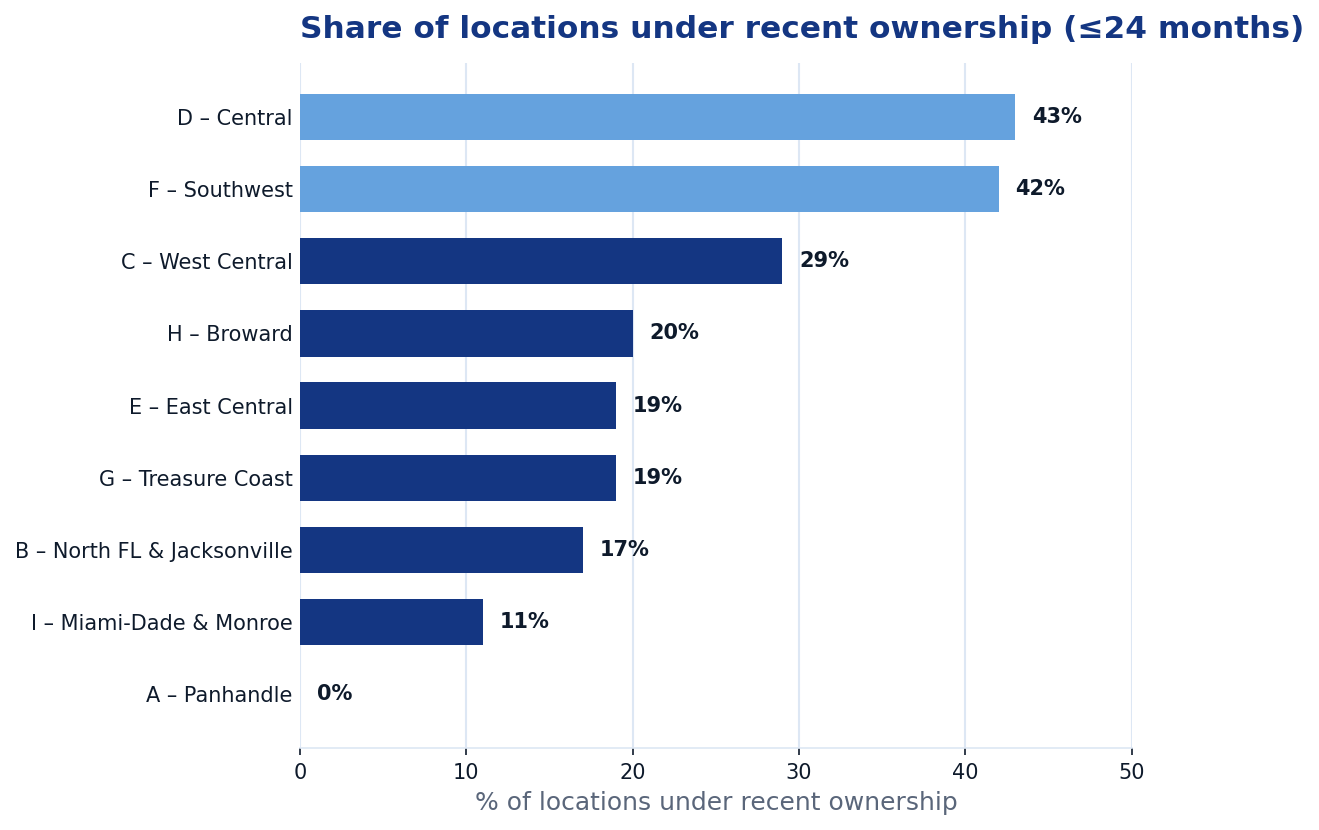
The geographic distribution of ownership activity does not match the geographic distribution of supply. The high-supply, high-bed-per-SSI-child southeast (Regions H and I) shows below-average ownership turnover — Miami-Dade and Monroe at 11%, Broward at 20%. The lowest-supply, lowest-ratio region (the Panhandle) shows none at all.
The highest ownership activity is concentrated in Region D (Central Florida — Tampa, Polk, and surrounding counties) and Region F (Southwest Florida). Both are middle-of-the-distribution regions in terms of bed-per-SSI ratio. Region D alone accounts for 9 of the 41 ownership-activity locations and 480 of the 1,634 beds whose current ownership is less than two years old.
Fragmentation among new licensees
A consolidation pattern would show a small number of receiving owners each acquiring or originating multiple locations. The data does not show this. Among the 41 locations with recent ownership activity, the ten receiving owners with the highest location counts each hold exactly one location.
| Receiving Owner / Licensee | Locations | Capacity |
|---|---|---|
| Lee Health System, Inc. | 1 | 45 |
| Secured Kids Care LLC | 1 | 9 |
| Little Sprouts LLC | 1 | 0 |
| Thrive PPEC LLC | 1 | 30 |
| Bright Minds PPEC LLC | 1 | 10 |
| Learning Tree PPEC Tampa, LLC | 1 | 150 |
| Rainbow Kids Pediatric Care, Inc. | 1 | 45 |
| Brightside Pediatrics LLC | 1 | 60 |
| Caring Hands PediPEC LLC | 1 | 20 |
| CareSquare PPEC of Palm Beach LLC | 1 | 24 |
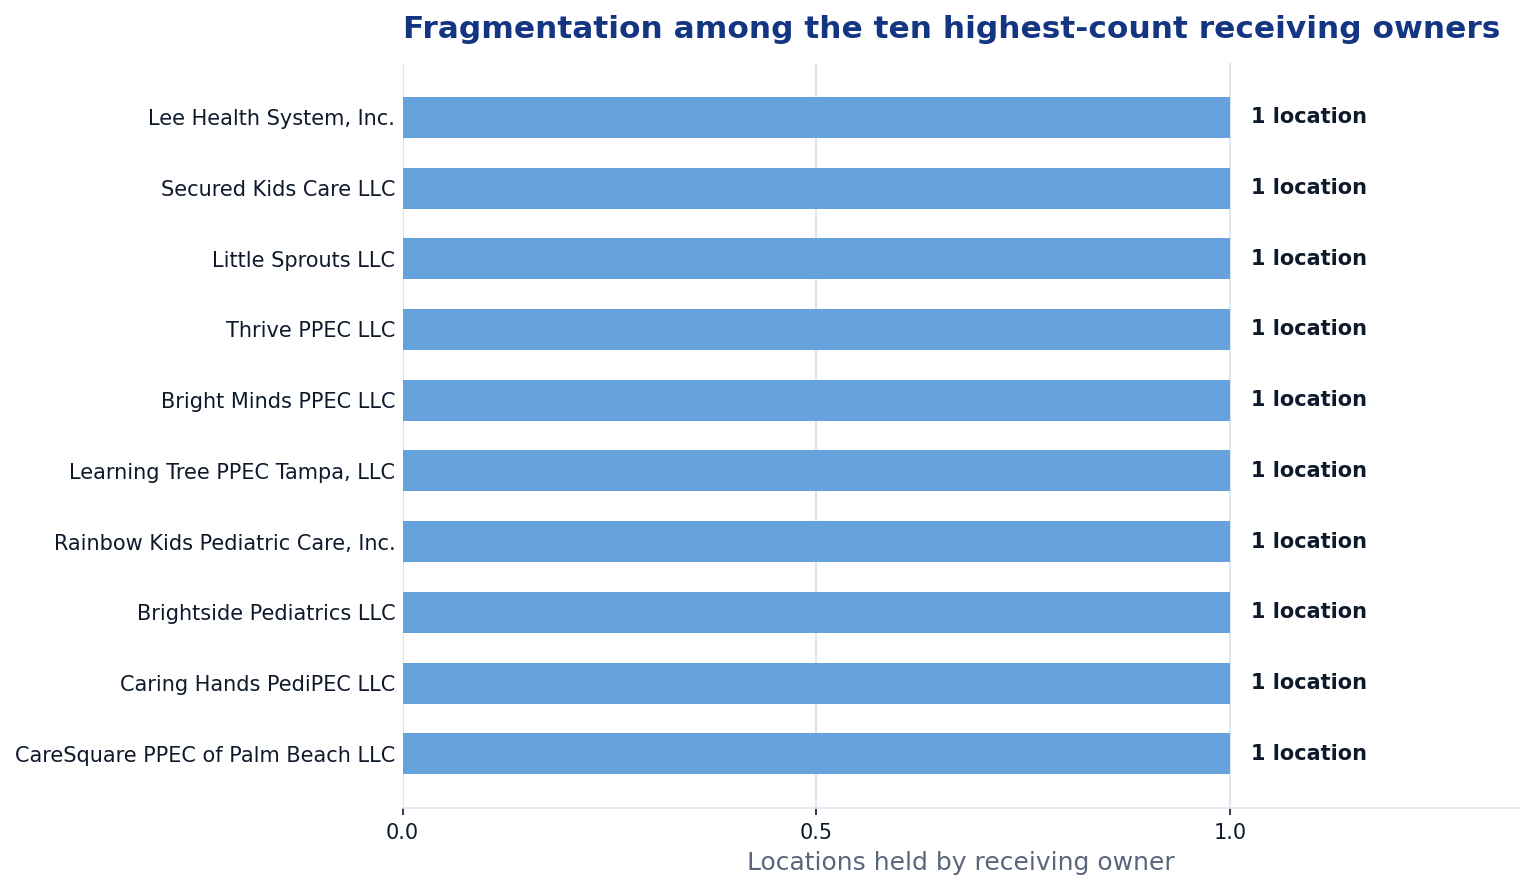
The pattern across the full set of 41 locations is consistent with the top ten: ownership activity is distributed across many small individual licensees rather than concentrating under any single buyer. We caution that licensee names in the public record are not normalized to parent entities — multiple LLCs under common parent ownership would appear as distinct licensees in this view, and a future analysis using Florida Sunbiz entity records could resolve some of that fragmentation. With that caveat, the public-record evidence does not currently show consolidation in Florida PPEC ownership activity. A consolidation thesis in Florida PPEC is not yet supported by the public-record evidence; the ownership activity that exists is real but distributed.
What this suggests
Three observations stand together as a market structure rather than three independent findings.
The eastern coastal corridor — Treasure Coast through Monroe — operates at materially higher PPEC bed-per-eligible-child ratios than the rest of the state. It is also the most stable region in terms of ownership: low turnover, established operators, comparatively little new entry.
The middle of the state — Central and Southwest Florida — is where ownership is currently moving through. New licensees are entering, but the receiving side of that activity is fragmented across many small operators rather than consolidating under any institutional buyer.
The Panhandle and most of North Florida operate at the lowest bed-per-SSI ratios in the state and show essentially no ownership activity. This is the geography where supply appears thinnest relative to medically complex pediatric population, and where market entry is currently least active. Region B specifically — holding the largest pediatric SSI population in the state — runs at one of the lower ratios.
For operators, this map indicates where competition is most concentrated, where capital is currently moving, and where structural undersupply has not yet attracted new entry. For investors, it suggests that a consolidation thesis in Florida PPEC is not yet supported by the public-record evidence; the ownership activity that exists is real but distributed. For payers and policymakers concerned with pediatric access, the geographic pattern points at specific regions where supply is most thinly stretched relative to medically complex pediatric population.
This brief reports the geographic structure as it stands in early 2026. Harbor expects to publish updated readings as new monthly enrollment data becomes available and as the public ownership record evolves.
Working with Harbor
Harbor helps PPEC operators understand intake, authorization, attendance, and billing readiness with the same discipline we bring to public market intelligence. If you operate, refer to, or evaluate PPEC centers in Florida, we would welcome the conversation.
Learn more at aegis-harbor.com or request a working session at aegis-harbor.com/demo.
Methodology and sources
Data sources
Florida AHCA Statewide Medicaid Enrollment Report, March 2026. Pediatric Medicaid enrollment by SMMC region was extracted from the AGEGROUP sheet of AHCA's monthly enrollment file. Pediatric SSI enrollment combines SSI Medicaid-only and SSI Duals categories, ages 0–18 and 19–20, summed across all health plans within each region. State-total pediatric SSI under 21 in this dataset is 102,462.
Florida AHCA public licensure data. Active licensed PPEC center identity, location, capacity, license status, and ownership-since date are observed from AHCA's published facility records, ingested into Harbor's public PPEC intelligence layer. Records included in this brief are filtered to current license status of LICENSED and to records that have passed Harbor's public-publishability review. Records in IN REVIEW or IN LITIGATION status are excluded from active supply totals.
U.S. Census Bureau, ACS 2022 5-year estimates. Under-18 population by Florida county was computed from table B01001 (Sex by Age), summing male and female estimates for the 0–4, 5–9, 10–14, and 15–17 age bins.
Harbor SMMC region crosswalk. County-to-region assignments follow AHCA's published SMMC regional structure. The crosswalk covers all 67 Florida counties.
Definitions
- Pediatric SSI means SSI Medicaid (Medicaid-only and Duals) enrollees ages 0 through 20 inclusive.
- Pediatric Medicaid means TANF and SSI Medicaid combined, ages 0 through 20.
- Active licensed supply means PPEC centers with current license status of LICENSED that have passed Harbor's public-publishability review.
- PPEC bed means a unit of licensed capacity as published in AHCA records.
- Ownership activity (≤24 months) means a center whose AHCA-published current-owner-since date is within the trailing 24 months from the analysis date. This measure includes both ownership transfers at existing centers and first licensure of newly operating centers under their original owner. The available public data does not distinguish these populations.
Limitations
Pediatric SSI enrollment is a floor estimate of PPEC-candidate population, not a ceiling. Some medically complex children are enrolled in TANF Medicaid rather than SSI, and SSI participation rates may vary by region in ways that are not fully reflected in this analysis.
The ownership activity measure does not separate change-of-ownership from de novo licensure. A future analysis incorporating original license issuance dates would allow this distinction.
Receiving-owner identity is reported using the licensee name as recorded in the public licensure data. Licensee names are not normalized to parent entities, and multiple LLCs under common parent ownership would appear as distinct licensees in the receiving-owner table. A future analysis using Florida Sunbiz corporate registry data could partially resolve this.
This brief reports supply concentration relative to a published proxy for medically complex pediatric population. It does not measure travel time, waitlist length, payer-mix fit, staffing, occupancy, or actual placement availability. Statements about supply relative to need are observations about the published data, not determinations of access adequacy.
Public-record data may be incomplete, delayed, or associated with prior owners or operators. This brief is not a regulatory determination, a quality rating, an endorsement of any operator, or a substitute for direct provider records or AHCA's primary sources.
Update cadence
Harbor expects to update this brief as new monthly AHCA enrollment data becomes available and as ownership records evolve. The next update is anticipated when material changes in the underlying public record warrant revision.
About Harbor
Harbor is the operating system for pediatric day-based care. We help PPEC centers connect intake packets, authorizations, attendance documentation, and billing readiness in a single workflow. We also maintain a public PPEC directory and intelligence layer that families, referrers, and operators can use to find and learn about Florida PPEC centers.
Educational brief. Not medical, legal, billing, or eligibility advice. Public-source intelligence only. Not a regulatory determination, quality rating, safety score, or provider endorsement. © 2026 Aegis Harbor, Inc.